A frequency table shows the frequency of an event – in simple words: how many times did it occur.
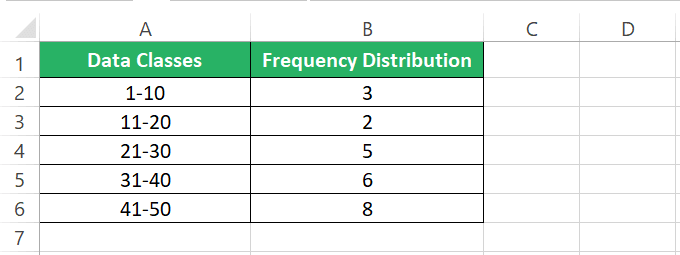
We all practiced tons of them during our elementary education, and to bring you back some reminiscences from those times, here’s one 🧐
Have flashbacks from old-school times?
This is a simple frequency table. However the frequency distribution that we are going to explore in this tutorial goes a step ahead.
Once you have calculated the frequency distribution for a given set of events, the next step is to calculate their relative frequencies. As the name suggests, relative frequencies refer to how you can study frequencies in relation and comparison to each other.
It is a very powerful statistical analysis tool that helps you study huge datasets at a glance, and I strongly recommend you grab your practice workbook for this guide here and tag along with me to learn to create these in Microsoft Excel.